Medical Visualization
Visit Repo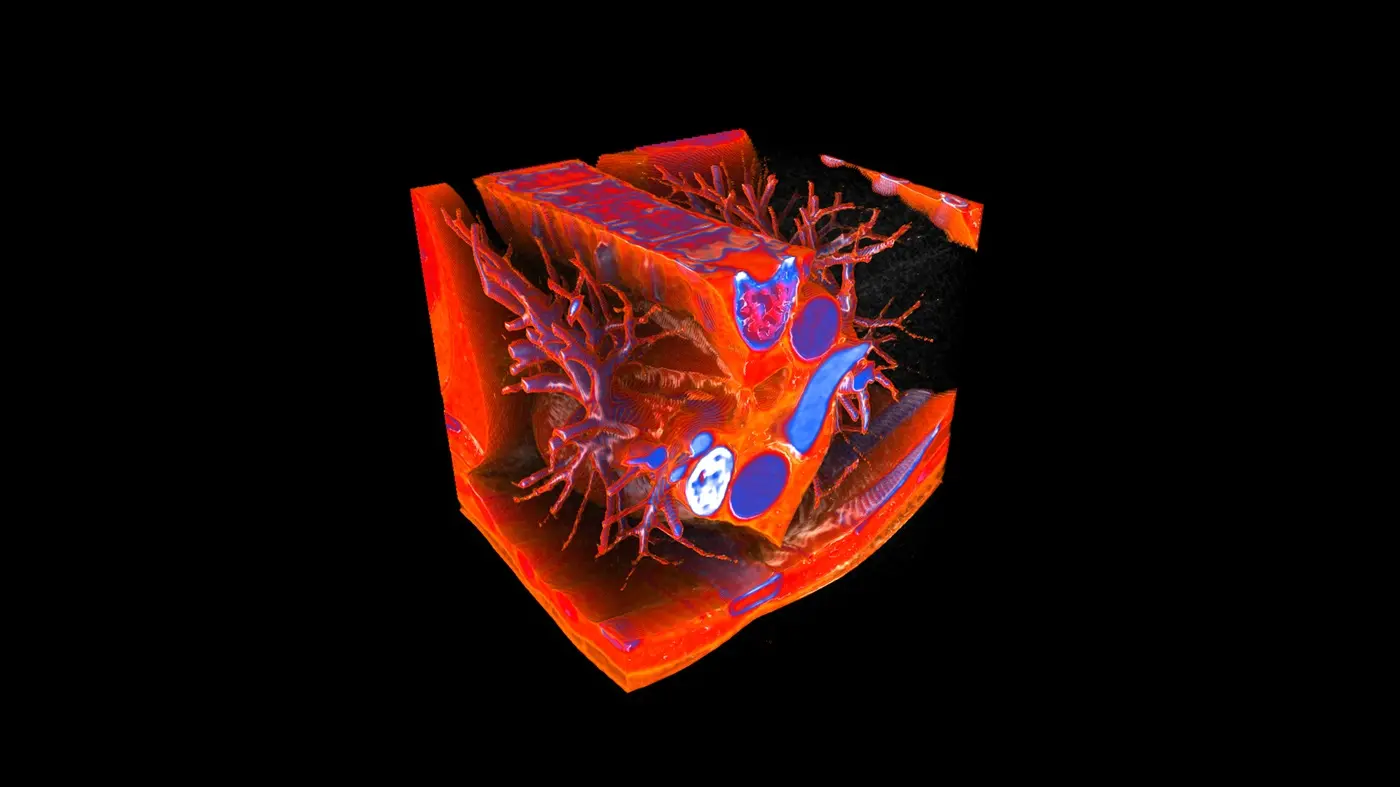


Overview
This project focuses on visualizing CT scan data with Qt and OpenGL using different techniques. It was developed as part of the Simulation and Data Visualization lecture.
The project consists of several features:
Volume Rendering
Rendering CT-scan data in 3D using ray casting.Slice Viewer
Inspect 2D slices of the 3D CT-scan volume.
In addition to the visualization work, this repo also includes a small pandemic simulation, which was implemented as a separate feature but was not the main focus of the project.
Volume Rendering Details
At a high level, the idea is to treat the CT scan as a semi‑transparent 3D volume and simulate how light passes through it, similar to fog. This makes it possible to reveal structures like bones or soft tissue in ways that make the data easier to interpret.
To achieve this, a cube that defines the bounding box of the data is rendered first. For every pixel on the cube’s surface, a ray is cast into the volume and sampled at regular intervals along its path. The sampled values are then accumulated to form the final image.
There are several techniques to accumulate the sampled values from the CT scan, but using transfer functions is probably the most interesting approach. They allow the user to map the raw CT scan values directly to RGBA color values. As the ray moves through the volume, these colors are accumulated until full opacity is reached. By adjusting the mapping, different parts of the scan can be highlighted in different colors.

Lighting can further enhance the rendering by improving depth perception when viewing from different angles. This requires estimating the normal at each voxel by sampling neighboring values and computing the gradient. After that a simple Phong lighting model can be applied to add shading.
Lessons Learned
In this project I learned how 3D datasets can be interpreted and visualized. Implementing ray casting on the GPU from scratch taught me a lot about shader programming and the trade‑off between image quality and performance. Working with real CT scan data also gave me a better understanding of the challenges of handling real‑world datasets.
It also highlighted how visualization techniques can make complex data easier to understand, which I carried forward into later projects.